Sunday, September 23, 2012

Tycho Brache, Mutability, & the Meaning of 500 Home Runs

Immutability: from Plato’s world of forms to Einstein’s cosmological constant, there is an apparent human need for this concept of stasis & eternal constancy: some even call it “heaven.”  These constants are, in the Platonic view, the very ground of being & meaning, separate from the transitory world.  So it should come as no surprise that in baseball—both a trivial thing, a child’s game played for money by adults, & a serious phenomenon, a sacred cultural drama—there should likewise be an imperative toward constants that can be said to contain unchanging meaning in & of themselves. & since, as we know, baseball is “a game of numbers,” those constants must be numerical!

Now, as I’ve suggested in other posts, there is a stance toward baseball numbers that is indeed Platonic in its underlying assumptions (tho with more than a touch of neo-Platonism, with the frankly mystical idea that a major function of statistics is to be predictive even more than descriptive); it isn’t difficult to see that a certain insistence on figures like Pythagorean Wins or BABIP or xFIP becomes an appeal to a realm beyond that of perceived reality. In such a reading, the Baltimore Orioles of 2012 aren’t really a good team, despite the fact that they have the second most wins in the American League; the Arizona Diamondbacks catcher Miguel Montero isn’t really a .293 hitter, because his BABIP (batting average on balls in play) is an unsustainable .368; Jered Weaver of the Los Angeles Angels may not really be the dominant pitcher he appears to be at first glance, as his xFIP (Expected Fielding Independent Pitching) is a pedestrian 4.10. Thus, we have the Baltimore Orioles, Miguel Montero & Jered Weaver who exist in the material world of change, but we also have the “form” of all three entities (as it were) in the immutable world of forms.


In European cosmology, this drive for immutability may have been conceived most elegantly in the Aristotlean/Ptolemaic model of the cosmos, in which the earth is at the center of the universe, & is ringed by eight planetary spheres: the Moon, Mercury,  Venus, the Sun, Mars, Jupiter, Saturn, & the region of Fixed Stars. Mutability ruled in the sublunary world (the Moon being the changeable heavenly body)—John Donne, in his "A Valediction: Forbidding Mourning” refers to “dull sublunary lovers’ love—whose soul is sense”—that is, lovers who are trapped in the material & transitory world below the moon; & even in the 20th century, W.B. Yeats wrote (in “Nineteen Hundred and Nineteen”):

Many ingenious lovely things are gone
That seemed sheer miracle to the multitude,
Protected from the circle of the moon
That pitches common things about.


In the Ptolomeic cosmology, there could be no change in the region of fixed stars—which explains the absolute disruption to this model when astronomer Tycho Brahe determined that the 1572 supernova in the constellation Cassiopeia was in fact a  new star, “never before seen in the life or memory of anyone” (a translation of the title of his treatise, De nova et nullius aevi memoria prius visa stella.) Thus, Brahe showed, the “Region of Fixed Stars” wasn’t actually fixed & immutable at all—stars appeared & vanished (Brahe also demonstrated that comets, rather than being sublunary events, passed thru the supposedly immutable sphere.) The importance to western cosmology & philosophy of Brahe’s supernova, or SN1572 as it is designated, can hardly be under-estimated.

But now we move to the realm of baseball, where Platonism—as it does perhaps in the popular culture overall—still exerts a powerful force!  Within the universe of baseball—the game of numbers—there are certain statistical figures that have an immutable quality, & if they admit some change over the course of time (because, like any good western sacred drama, baseball exists simultaneously in historical & mythical time), there meaning remains unchanged. Among these figures the meaning of which has remained apparently immutable, we would name the “great” career statistics of 300 wins for pitchers & 3,000 hits & 500 home runs for hitters. Certainly throughout the lifetimes of most baseball fans, the meaning of those three numbers has seemed immutable—once a player attained to any of those numbers, his greatness is a fait accompli; he becomes a fixed quantity—in baseball terms, a Hall of Famer.
 
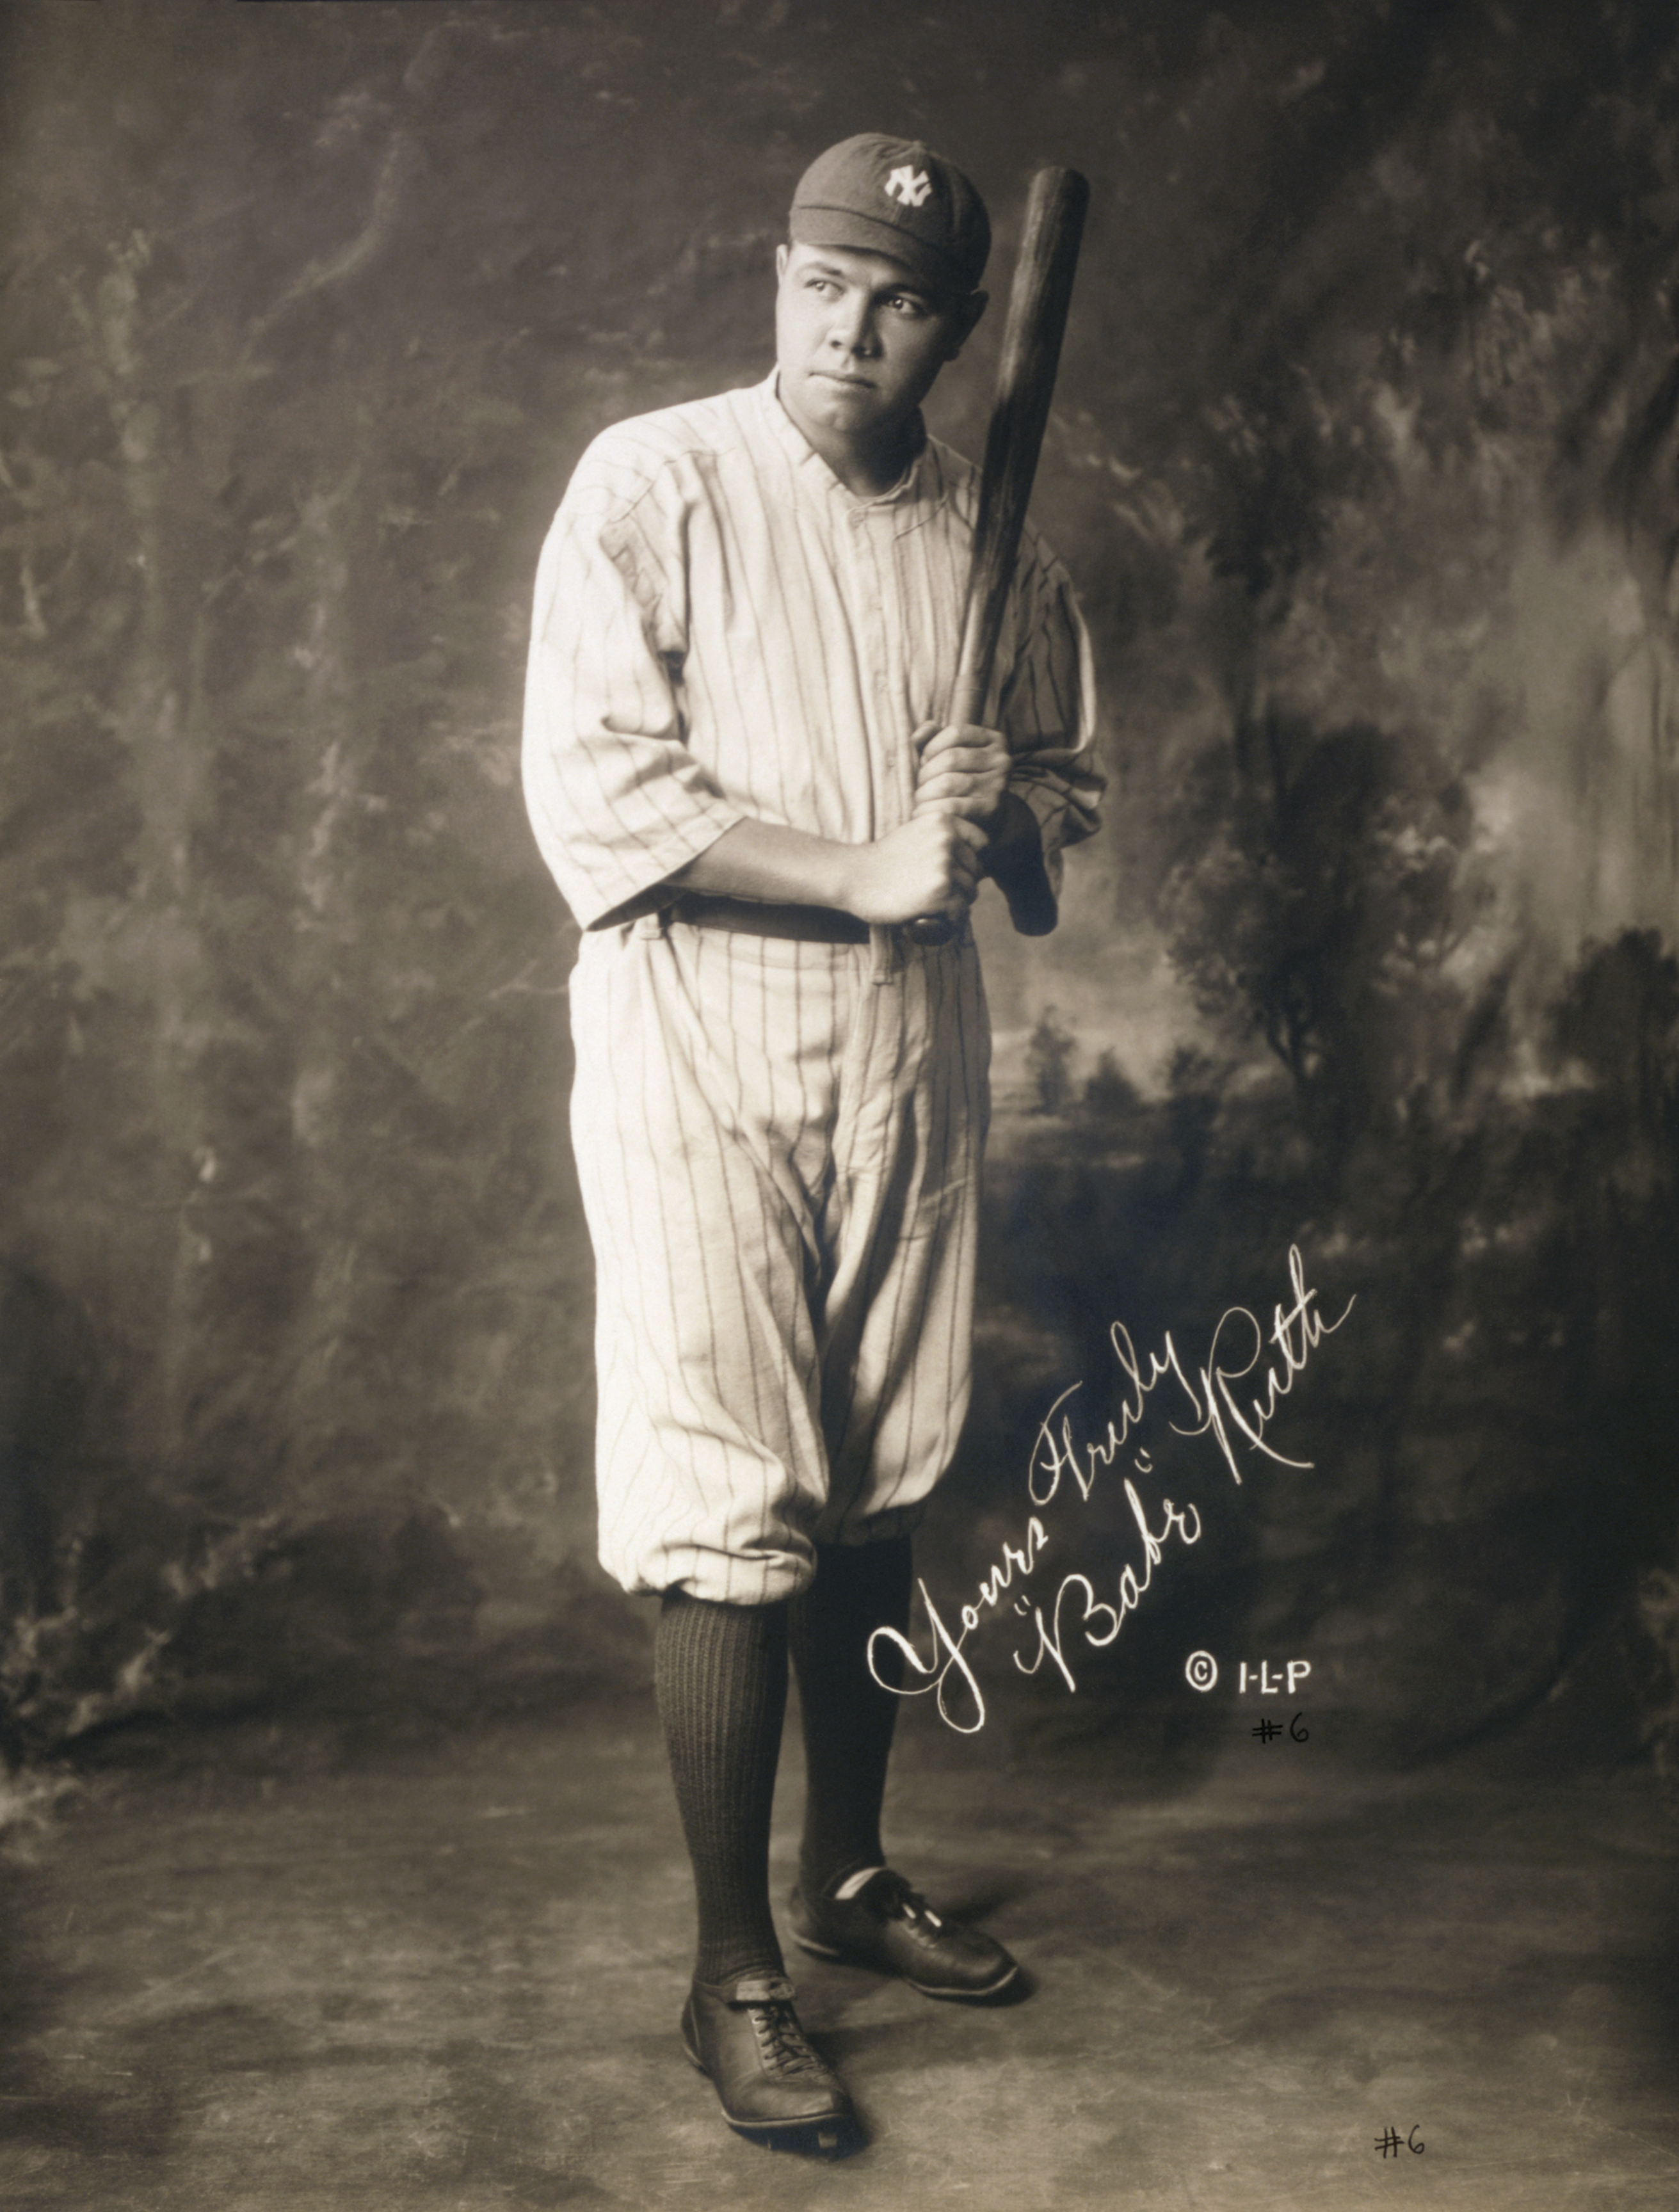
All three of these numbers are worth examining in hermeneutic terms, but for today, let’s simply consider 500 home runs, & let’s look back 50 years to 1962.  In that year—within my lifetime, tho a few years before my interest in baseball became keen—there were only four men who’d achieved 400 home runs in their career: Babe Ruth, Jimmie Foxx, Ted Williams, & Mel Ott. The meaning of 500 home runs was that these four players were the greatest of the great in terms of power hitting, & Ruth, who’d shot well past the 500 region of fixed stars into the empyrean of 714 home runs had indeed transcended the game; a legend, even a myth within 20th century U.S. culture. Meanwhile, the remainder of the top ten were also the greatest of the great, even Gil Hodges in 10th place with his 370 lifetime home runs. Stan Musial, Mickey Mantle & Eddie Matthews, the three active players on the list (Williams had retired at the end of the ’61 season) were all destined for legendary status themselves.

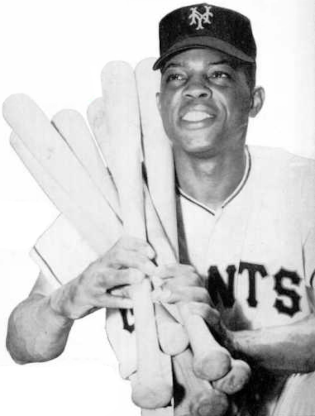
But if we skip ahead a mere 10 years to 1972, we see that this unalterable top 10 list is much changed. To begin with, 500 home runs has now become the essence of greatness: none of the best of the best have hit fewer than 512 home runs, & in fact Mel Ott, the great Giant, has slipped out of the “region of fixed stars,” while newcomers Ernie Banks, Frank Robinson, Harmon Killebrew, Willie Mays & Hank Aaron have entered the realm of immutable greatness—in fact, Aaron & Mays have both surpassed the 600 home run barrier & stand on a threshold to Ruth’s 714 empyrean. In fact, eight of the ten members of this group had playing careers that included at least some of the 1960s.


By 1982, the list had grown to 11, simply because Ernie Banks & Eddie Matthews remained tied for the final spot with 512, while Willie McCovey had also joined the group. Actually, this configuration obtained from 1979 thru 1984 (the only change being that McCovey hit one more home run to tie Ted Williams at 521); & I’d say it was this grouping that dates from around 1972 that has been formulated in more recent memory into the concept that 500 home runs is a numerical form that is the essence of a Hall of Fame slugger. Certainly that wasn’t the case when the Hall of Fame accepted its first inductees for enshrinement in 1936; at the end of the 1936 season, only Ruth had surpassed 500 home runs (he already had his 714, having retired in 1935.) Lou Gehrig was the only other major league player who had surpassed 400 home runs at that time.

 & indeed, Ruth was the only inductee in 1936 who had amassed what we’d consider a remarkable number of home runs; the two other position players named were Ty Cobb (who got the highest percentage of votes & had 117 career home runs) & Honus Wagner (101 home runs—which as late as 1922 had him in a tie for 10th place all-time!) The next player inducted who’d be considered a slugger by today’s standards was Lou Gehrig in 1939 (with his 493 home runs in a career cut short by the terrible disease that has been given his name); following Gehrig, the next that would even come close to being a slugger by today’s definitions would be Rogers Hornsby in 1942 (301 career home runs, which kept him in the top 10 thru 1952); & then finally the next two 500 home run hitters, Jimmie Foxx & Mel Ott in 1951.


But recently, 500 home runs has come to be seen differently: the region of fixed stars is no longer immutable (not, as we see now, that it ever really was!) As of this writing, only four of the eleven men found on the 500 home run list in the defining post 1972 period are still among these greatest of the great: Ruth, Aaron, Mays & Frank Robinson.
 

Just as Brahe observed that changes occurred in the so-called region of fixed stars, we observe that changes have occurred to 500 home runs—whereas there were three such players 50 years ago, there are now 25 (& soon 26, as Albert Pujols is only another good season away from the total): a 1150% increase. We don’t seem to accept that there can be 25 players among the unquestionably great—three, yes; a dozen, yes. Even when the list expanded to include Mike Schmidt & Reggie Jackson in the 1980s, consensus didn’t waver. But when Rafael Palmeiro ended his career with 569 home runs & Gary Sheffield retired with 509, there was a growing contrary consensus that 500 was no longer the immutable figure we had thought. In addition, when the names of several of the players who have achieved 500 home runs (& in some cases, 600 or 700) within the past decade were also linked to rampant use of performance-enhancing drugs, then the supernova had exploded. What did it mean that Barry Bonds hit more home runs than any player in major league history (762) when there is a large amount of circumstantial evidence pointing to his use of such substances? What does it mean that Alex Rodriguez has hit 647 to date or that Mark McGwire hit 583, when they admitted themselves to the use of these drugs; what does Palmeiro’s total mean in the light of a failed drug test?

These are interesting questions, of course, tho ones to which we won’t ever really have answers. More to the point in my mind is the fact that, just as there never was an immutable region of fixed stars, the “immutable” meaning of 500 home runs has simply been a historical phenomenon that at most had significance for approximately 50 years of major league baseball’s 136 year history. For that matter, 100 home runs was a very significant figure for about the same amount of time; Harry Stovey became the first player to 100 in 1890, & as recently as 1931 half of the top ten home run hitters of all-time had totals between 169 & 196; 1934 was the first year when a total of 200 was required to make the top ten.

The mutability of meaning & being: even in baseball! 


All images link to their source
  1. Babe Ruth, 1920: Wiki Commons - public domain (Library of Congress)
  2. The Ptolomeic Cosmos (1524 print): Wiki Commons - public domain
  3. Tycho Brahe's star map of the constellation Cassiopeia showing the position of the Supernova of 1572 (the supernova is the large star marked "I"): Wiki Commons - public domain
  4. Mel Ott, 1940 Bowman Gum baseball card: Wiki Commons - public domain (copyright expired, not renewed)
  5. Tycho Brahe: Wiki Commons - public domain
  6. Mark McGwire: "Mark McGwire, St. Louis, 2001. This picture was taken during a Saturday afternoon game against Detroit on July 14, 2001. It depicts McGwire's 10th home run of the season and 564th of his career, moving him ahead of Reggie Jackson for sixth on the all-time list." Wiki Commons - by Rick Dikeman, who publishes it under the under the Creative Commons Attribution-Share Alike 3.0 Unported license.
  7. Harry Stovey on a 1887-1890 Goodwin & Company baseball card (Old Judge (N172)): Wiki Commons - public domain
  8. Composite X-ray and infrared image of the SN 1572 remnant as seen by Chandra X-Ray Observatory, Spitzer Space Telescope, and Calar Alto Observatory: Wiki Commons/NASA - public domain
   

Friday, September 14, 2012

Mike Trout, Stephen Hawking, & the Arrow of Time

The increase of disorder or entropy with time is one example of what is called an arrow of time, something that distinguishes the past from the future, giving a direction to time.
Stephen J. Hawking, A Brief History of Time

In his beautiful book, A Brief History of Time, Stephen Hawking addresses questions such as “Why do we remember the past & not the future?” Why indeed? According to Hawking, the fact that “psychological time” (how we experience time) & the thermodynamic arrow of time—namely, the law of entropy, a sort of ontological Murphy’s Law—are in profound accordance with each other.  To use Hawking’s own example, we remember the cup falling off the table & breaking on the floor because this obeys the Second Law of Thermodynamics, which is also how our mind operates: we don’t experience the broken cup re-assembling itself & leaping whole from the floor to the table as in a backwards film. Hawking also connects this to the concept of the expanding universe.


But what can this possibly have to do with Los Angeles Angels outfielder Mike Trout?  If you’ve followed baseball even casually this season, Mike Trout needs no introduction; but for the sake of readers who are fans of Beer League Box Score without necessarily also being baseball fans, I’ll say that Trout has been probably the best player in major league baseball this year, despite the fact that this is his first full year, & despite the fact that he was all of 20 years old when the season began.

Mike Trout has been one of those prospects that fill the vivid fantasies of hardcore baseball fans with visions of mind-boggling stats & that stoke the championship fantasies of Angels fans everywhere. Despite a brief & pedestrian call-up last summer (during which he didn’t amass enough at bats to lose his rookie eligibility), Trout was highly touted coming into the season, & tho he didn’t leave spring training on the Angels roster, he was called up on April 28th to an Angels team off to a disappointing start. Predicted to be one of the strongest teams in the American League, the Angels’ record after April 27th was 6 wins & 14 losses. Although Trout started slowly his first few games, he put up a .324/.385/.556 slash line in May, scoring 21 runs, hitting 5 home runs & stealing 8 bases—& Trout was just getting started. He peaked with an unbelievable .392/.455/.804 in July, scoring 32 runs, hitting 10 home runs & stealing 9 bases (note: each month is almost exactly 1/6 of the season), & while he came back toward earth from the troposphere in August, he still posted a .284/.366/.500 line with 26 runs scored, 7 home runs & 11 stolen bases. His June was only slightly less elevated than July, while his September stats continue to be strong, if considerably more earthly than at mid-season.


This sort of performance really can’t be predicted or expected. People in the know realized Mike Trout was very good, & he had been compared to Mickey Mantle, Willie Mays & Rickey Henderson—all first ballot Hall of Famers! Obviously such comparisons are odious in the extreme, & particularly in light of his short & pedestrian 2011 debut, it wouldn’t have been at all surprising if he had fallen far short of such lofty expectations.
 
But instead, Trout is a nonpareil—a “singularity,” if we can borrow a term from Professor Hawkingwho seems to defy all the laws of physics, at least as they apply to baseball performance. His overall season statistics thru September 13th are as follows: .331/.396/.569; 27 home runs; 45 stolen bases; 114 runs scored; he’s even driven in 77, despite batting lead-off (typically not an rbi slot in a line-up.) To look at his season in terms of major sabermetrical measures, he has a wRC+ of 174 (which means he’s creating runs for his team at a rate of 74% above the league average player) & a wOBA (weighted on-base average) of .424 (from Fangraphs.) Moving to Baseball Reference, we find that this site calculates his “wins above replacement player” at 10.3—meaning that by this formulation, he has added 10 wins to his team’s total above what the fictional “organizational player/replacement player” would have added. 

The 10.3 WAR is significant at a number of levels. In the entire history of major league baseball, dating back to the 19th century, players have achieved a 10 WAR only 47 times—in fact, players have achieved a WAR of 10.3 or higher only 28 times, including Trout! I made a survey of the 33 position players (as opposed to pitchers) who were first ballot Hall of Fame selections, plus the two who were inducted by special election (Gehrig & Clemente, in both cases due to untimely deaths), & found that a whopping 23 of those 35 had never had a single 10 WAR season—& the list of 23 includes such major figures as Hank Aaron, Rickey Henderson (he just missed with 9.8 in both 1995 & 1990), Frank Robinson, Mike Schmidt & Roberto Clemente. In addition, the highest WAR for a position player rookie was Shoeless Joe Jackson’s 9.0 in 1911; the highest post 1920 (the "live ball" era in which we still find ourselves) is the 8.5 registered by Dick Allen for the Phillies in 1964. If we look at the three great players with whom Trout has been compared, Mays, Mantle & Henderson, we also find that their rookie season WAR figures were 3.6, 1.3, &  -.1 respectively! It is true that Mantle & Henderson played partial seasons in their rookie years (tho with enough at bats to use up rookie eligibility), & each skyrocketed in the next year to 6.3 & 8.7 respectively; & that 6.3 season was Mantle’s age 20 year; the 1.3 was compiled when he was 19. 

Of course such singular efforts have made Trout a runaway choice for the Rookie of the Year award, but his season has also made him a favorite for the American League’s Most Valuable Player award. He has some competition—Miguel Cabrera & Josh Hamilton are probably the two most likely rival candidates—& it is true as I mentioned that his statistics have gone from unheard of to merely very good while the pennant races have heated up (& while his team has struggled to maintain traction for a playoff spot.) But all things considered, I would think Trout is the deserved favorite. In fact, for those who don’t know, only two players have ever won both Rookie of the Year & Most Valuable Player in their debut season; both, interestingly, were American Leaguers: The Boston Red Sox Fred Lynn in 1975 & the Seattle Mariners Ichiro Suzuki in 2001.  Of course, Ichiro was a special case, since he had already had a star career in the Japanese major leagues staring in 1994.

& it’s when we begin to consider some of Trout’s rookie comparables that we begin to see the connection with Professor Hawking. Fred Lynn posted a .331/.401/.566 line, with 21 homers, 103 runs scored & 105 driven in for the ’75 season. His WAR value was 7.1; in terms of sabermetrics, his wOBA was .427 & he had a wRC+ of 162; & Lynn only had one other really comparable season—some might say an even better one, actually—in 1979, his penultimate season with the Sox before he moved on to the Angels as a free agent. Don’t get me wrong—Fred Lynn was a good major league ballplayer for most of his career—but there were only two seasons that approached Olympian heights.

I also should mention the two players who’ve had the highest rookie WAR before Trout—both pitchers. These were Russ Ford of the 1910 New York Highlanders with a WAR of 10.6! & Mark “the Bird” Fidrych of the 1976 Detroit Tigers—9.3 WAR. Sadly, Fidrych’s arm gave out after that one glorious year & Ford also was out of organized baseball after 1915, also with arm troubles.  & finally, how many players have had multiple 10 WAR seasons? Babe Ruth had 8, but he was a true phenomenon;  Willie May had 6; Mantle 3; you can find the complete list here.
The Second Law of Thermodynamics does indeed apply to the ballplayer & the ballplayer’s body (as it does to us all!); the exertion of performance strains tendons & ligaments & joints; eyesight worsens over time; hand-eye coordination & other reflexes slow. In theory, Mike Trout qua baseball player is already the intact cup in flight toward the floor. We can’t remember him from whatever future season during which he may (or may not) peak in his skills in reverse to this season’s glorious outburst.  & lest we forget, even the greatest of the great, those that actually do fulfill their potential against all the odds of entropy, eventually break down: Ruth, Mays & Mantle had all lost a high percentage of their skills by the time they each retired.

But Professor Hawking also writes about “imaginary time” (time calculated using “imaginary numbers”) & “real,” linear time. This is of philosophical & scientific importance because if the universe begins & ends in singularities (as in the model of General Relativity), the universe wouldn’t obey physical laws at its beginning & end; but if time is considered in its “imaginary” form, there would be no singularities as such; it would be like a sphere, finite, but with no boundaries. Hawking goes on to write:

This might suggest that the so called imaginary time is really the real time, and that what we call real time is just a figment of our imaginations. In real time, the universe has a beginning and an end at singularities that form a boundary to spacetime and at which the laws of science break down. But in imaginary time, there are no singularities or boundaries. So maybe what we call imaginary time is really more basic, and what we call real is just an idea that we invent to help us describe what we think the universe is like.


I think of this—perhaps tweaking & even mistreating Hawking’s intent a good deal!—when I consider Mike Trout.  It occurs to me that there’s a point of comparison between Hawking’s concepts & the concepts of history versus liturgical or mythic time. Now I’ve mentioned before that baseball is charged with aspects of sacred drama, & as such, it obeys some of the rules of mythic time—or if you will, “imaginary time”—finite, but with no boundaries. The season begins & moves thru its narrative arc. Certain archetypal events & personages emerge; the season ends, only to be renewed again the following spring. In “linear time,” that season produces real names, real winning & losing teams, real statistics. But whenever we encounter the baseball archetype of the “phenom,” the young player who remakes the game like some mythic hero—or who emerges like a singularity, for whom the laws of physics have no power—we see him as ageless; we project his seasons ahead into summer following summer full of glory.  We forget the laws of the physical universe. We already remember the full glory of Mike Trout’s glorious career.


All images link to their source
  1. Mike Trout: Wiki Commons, by user Keith Allison, who publishes it under the Creative Commons Attribution-Share Alike 2.0 Generic license.
  2. The "intersection" of past & future in spacetime: Wiki Commons, SVG version: K. Aainsqatsi at en.wikipedia
    Original PNG version: Stib at en.wikipedia; This file is licensed under the Creative Commons Attribution-Share Alike 3.0 Unported license
  3. Willie Mays, 1954: Wiki Commons; public domain (from Baseball Digest-copyright expired, not renewed)
  4. Mike Trout July 22, 2011: Wiki Commons, by user Keith Allison, who publishes it under the Creative Commons Attribution-Share Alike 2.0 Generic license.
  5. Fred Lynn from http://baseballhistorypodcast.com
  6. NASA StarChild image of Stephen Hawking: Wiki Commons, NASA image, public domain
  7. Time Line of the Universe [linear!]: Wiki Commons, NASA image, public domain
  8. Los Angeles Angels center fielder Mike Trout :  Wiki Commons, by user Keith Allison, who publishes it under the Creative Commons Attribution-Share Alike 2.0 Generic license.

Wednesday, September 5, 2012

Pythagoras & Orioles & the Winning Mysteries

We all know the pre-Socratic philosopher Pythagoras by his theorem involving the area of right triangles. Beyond that, however, this figure who was of such importance in the ancient world—who was considered to be one of the many “god-men” of the Classical period—has now become otherwise obscure. In fact Pythagoras was the founder of a popular religious cult which, in good Hellenic style, practiced various mysteries, & also led ascetic lives, professing a belief in the transmigration of souls, practicing vegetarianism & famously abstaining from beans.

Oddly, one place where Pythagoras’ name is currently invoked is in the world of baseball, in the form of “Pythagorean expectations” (the original term as coined by Bill James) or, more commonly, “Pythagorean wins.” If you remember your high school geometry class, you’ll recall that the Pythagorean theorem runs as follows: a2+b2=c2, where a is the right angle side of the triangle, b is the base & c is the hypotenuse (the other side!) Bill James created a similar formula to determine how many wins a team would be expected to achieve based on the number of runs they scored & allowed. In James’ original formula, Pythagorean expectation is described as follows:


This formula, like others that James created, has received some tweaking over the years, but the idea behind it remains the same: whatever a team’s actual won-loss record states at a given point of time, there is an ideal won-loss record that exists that more clearly captures the team’s true essence.

Now we turn our gaze to this very baseball season, & to the city of Baltimore, Maryland, home of the Orioles baseball team. As of this writing, the Orioles are tied for first place with the New York Yankees for first-place in the American League East Division; worth noting here that 1. the American League East is typically considered baseball’s strongest division, & 2. the Yankees are considered one of the top two or three teams in the Majors this year, & were a favorite to win the division from the onset. If the Yankees were to have been challenged for the division, conventional wisdom this spring ran, it would be by their long-time rivals, the Boston Red Sox & perhaps the always tough Tampa Bay Rays. The Orioles were seen as a cellar team, lagging behind the Toronto Blue Jays.


Adam Jones looks to the heavens


But the Red Sox, as they have a wont to do at regular intervals throughout their existence, found all sorts of intriguing—if hideous—ways to implode & jettison their season, & Toronto suffered a staggering number of injuries both to their starting pitching staff & to key players. Tampa has performed well thru the season overall, tho they are held back by a somewhat weak offense, & also lost their slugging third baseman Evan Longoria for a good portion of the year. Now Longoria is back in the line-up, & that seems to have given them a bit of a boost, tho it’s clear that he’s still suffering effects from the injury.
CC Sabathia, who has been injured off & on in 2012
The Yankees, meanwhile, dominated as expected for the first half of the season, & they were seen as an easy division winner. Boston was done, & while the Rays might challenge them (& have been favored to take one of the two “wild card” playoff spots), they were seen as sufficiently flawed to have little chance of taking the division title.

& then there were the Orioles. They’ve spent the season occupying one of the top three spots in the division standings—they even led at one point in the spring before the Yankees caught them; after all, there’s often a surprise team in the first month or two that is ultimately humbled by the real powers. But Baltimore, as they say in baseball, “refused to go away.” Despite being scoffed at by most baseball pundits, who opined bluntly that the Orioles are not “for real,” they stayed within striking distance of the division lead, & also maintained their position as one of the top candidates for the wild card spots. & as of yesterday, 9/4/12, when the Yankees lost to Tampa & the Orioles defeated Toronto, Baltimore & New York found themselves in a tie for first.

The Yankees are a team filled with stars, but stars who are old in baseball years—as a result, they’ve suffered a number of key injuries down the stretch. Some commentators recently have said, well yes, the Orioles took 2 out of 3 from the Yankees this past weekend, & yes, they’re in a dead heat, but this is not the “real” Yankees, & the Orioles will soon see their magic coach become a pumpkin again.

Pythagoras: detail from Raphael's "School of Athens": on paper

The reasoning, beyond simple line-up comparisons (& yes, the Yankees do look like the far better team “on paper”), has to do with run differential, which if you followed the Pythagorean expectation formula above, is obviously key to that method of calculating “expected” or it might be said “ideal” (in the philosophical sense) wins. The Yankees have outscored their opponents by 83 runs, the second best total in the American League (trailing only Texas at 118); Tampa is close, with an +81 differential, & they do only trail the Yankees & Orioles by 1-1/2 games. The Orioles, meanwhile, have surrendered 19 more runs than they have scored, & still are tying the Yankees with a record of 76-59. By point of comparison, the Red Sox have been outscored on the season by 8 runs, & their won-lost record stands at 63-74, a full 14 games out of first; the team with the closest run differential to the Orioles (admittedly, in the National League) is the Philadelphia Phillies, who have been outscored by 21 runs, have a 65-71 record & are 18-1/2 games out of first place in the National League East!

Zach Britton
How have the Orioles accomplished this? They’ve won a lot of close games—a fact that most of the sabermetrically-inclined will put down to luck, & as we know luck only holds so long. They have a bona fide young star in centerfielder Adam Jones, & a good player in right fielder Nick Markakis (tho he was injured for a significant amount of time); they have a dominant bullpen with closer Jim Johnson & set-up Pedro Strop, & such a bullpen will enable a team to have a good record in close games; they also have a talented catcher in Matt Wieters, & they have the very streaky Mark Reynolds & Chris Davis: destroyers of baseballs when they’re on a roll & almost sure outs—with oodles of strikeouts—when they’re not. Lately, both have been hot, especially Reynolds; & young starting pitcher Zach Britton, who was out with a shoulder injury until July, has been dominating like a true ace.

There are essentially four weeks remaining in the season, & there’s a good chance that at least a couple of teams who are currently in the playoff picture will fade by the beginning of October. Certainly the Orioles could be one of those teams, & if one were a gambler (which I’m not), that would probably be the smart bet.

Epicurus
But as they say, the “games aren’t played on paper, they’re played on the field.” I love this: being strongly of the Epicurean bent, I strive to believe in “what is” rather than “what is actually true" sub specie aeternitatis. It’s intriguing to me how Pythagoras has been attached to this very idealistic pursuit of calculating team’s “ideal” (in the Platonic sense) records; of course, Pythagoras was also an idealist philosopher & an influence on Plato. He would indeed believe in the form of the New York Yankees & the form of the Baltimore Orioles, & would certainly understand the concept that the Orioles’ record is a shadow cast on the wall of the cave—an imperfect & distorted likeness.

For myself, I’ll follow the story with interest—it’s these very narratives that make the epic baseball season so compelling. Of course, tho I’ve long given my allegiance to the San Francisco Giants & the National League, I still have enough vestigial Red Sox fan in me from my youth to get delight on those rare occasions when the Yankees fall—tho interestingly, when I was in grade school & high school, the Orioles were the dominant team always ahead of the Sox—I was too young to really be cognizant of the early 1960s Yankees powerhouses featuring Mantle, Maris, Ford et al. I remember the Orioles of Frank & Brooks Robinson, Jim Palmer, Mike Cuellar, Boog Powell, Paul Blair & more—incredibly strong teams.

Soon enough, October 3rd will be upon us, & if we don’t know how the regular season portion of the 2012 baseball epic ends that morning, we certainly should by that night. Until then—probability & the ideal aside—days will pass, plays will be made, pitches thrown, balls hit, & games will be won & lost.


Orioles Park at Camden Yards: Cave of Shadows or Seat of Being?


All images link to their source
  1. Bust of Pythagoras of Samos in the Capitoline Museums, Rome: Wiki Commons: by Galilea, who publishes it  under the Creative Commons Attribution-Share Alike 3.0 Unported license.
  2. Pythagorean expectation formula: Wikipedia page on the subject. 
  3. Adam Jones popping one up: Wiki Commons, by user Keith Allison, who publishes it under the Creative Commons Attribution-Share Alike 2.0 Generic license.
  4. C.C. Sabathia [Yankees star pitcher]: Wiki Commons by chris.ptacek, who publishes it under the Creative Commons Attribution 2.0 Generic license.
  5. Detail from Raphael's "The School of Athens": Wiki Commons, public domain
  6. Zach Britton Wiki Commons, by user Keith Allison, who publishes it under the Creative Commons Attribution-Share Alike 2.0 Generic license.
  7. Epicurus, ancient Greek philosopher. From Thomas Stanley, (1655), The history of philosophy: Wiki Commons, public domain
  8. Oriole Park at Camden Yards: Wiki Commons by Kevin Farner, who publishes it under the Creative Commons Attribution 2.0 Generic license

Sunday, September 2, 2012

Chickens & Eggs & Pitcher Wins

...the problem about the egg and the hen, which of them came first, was dragged into our talk, a difficult problem which gives investigators much trouble. And Sulla my comrade said that with a small problem, as with a tool, we were rocking loose a great and heavy one, that of the creation of the world...
Plutarch, The Moralia

We do acknowledge that baseball—like domestic fowl—enables us to ask cosmic questions. If two separate things that have an apparent separate existence are each essential to the other’s existence, how can one thing pre-date the other? That’s the venerable conundrum about the chicken & the egg—a question that not only engaged Plutarch, but also Plato, Aristotle & late Roman philosopher Macrobius, just to name a few.

Now in the case of baseball, you must have a team & you must have a pitcher—& for the purposes of our examination, you must eventually, at the end of each game, have a win. Of course, you’ll have a loss, too, but that’s only important to our discourse by implication—& we discount the notion of a tie, which in theory at least should never occur.  So here is our philosophical conundrum: does the team win because the pitcher is good or is the pitcher good because the team is good?


Just as your take on the chicken & egg question will determine your basic views about creation itself (if we believe Plutarch—& it’s worth noting that Plato & Aristotle, as would be expected, had very different answers), your response to our baseball conundrum will say a lot about whether you favor traditional stats or the more contemporary ones—& of course, will by extension say a lot about your perspective on the game itself.

Many people, myself included, realized some time ago that the pitcher win statistic had its drawbacks. Clearly, a pitcher on a team that scores a lot of runs is going to have an easier time gaining wins than a pitcher on a team that scores fewer—anyone who’s followed the Giants over the past several years knows this—tho this year the Giant’s offense is a bit more robust. For instance, Giants ace pitchers Matt Cain & Tim Lincecum have never recorded 20 wins in a season—20 wins having been a long-time benchmark of excellence or proficiency, depending on the era. Cain’s high was 14 wins in 2009, while Lincecum’s was 18 in 2008; & this is despite the fact that many of their other statistics have been top-notch during their careers.

Of course, there have been a few noteworthy exceptions to this—pitchers who’ve amassed significant win totals despite playing on a poor team. The most noteworthy, at least in recent memory, was Steve Carlton who won 27 games for the 1972 Philadelphia Phillies—a team that won only 59 games! In addition to being credited with the win in 46% of his team’s victories, Carlton also led the league in earned run average, strikeouts, complete games (30), innings pitched & strikeout to walk ratio.


Conversely, you have pitchers whose win totals were no doubt helped by being on strong teams. Certainly if you look back at some of the legendary Yankees pitchers like Lefty Gomez & Whitey Ford, you’ll find that they achieved high win totals in seasons that were good, but not otherwise statistically dominant. For instance, Gomez never registered a strikeout to walk ratio greater than 2.09 (this means he struck out just over 2 batters for every one he walked); this was in 1937, & he never reached a 2 to 1 ratio again. In fact in 1936, his K/Walk ratio was 0.86.  In Whitey Ford’s famous 25 win season in 1961, his ERA was 3.21—not bad, certainly, but not dominant; likewise, his ERA + was 115, which is only a bit above average, & he also walked 92 batters, which is a high total. Of course Gomez & Ford are both justifiably renowned—but for instance in 1937, when Gomez posted a 21-11 record, the Yankees were averaging 6.2 runs per game; in 1961 while Ford was compiling his 25 win season, the Yankees scored 5.1 runs per game to lead the major leagues. In addition, both the mid 1930s & the early 1960s Yankees teams boasted several good fielders, & this of course aided both Gomez & Ford not only in amassing wins, but also in terms of earned run average, limiting hits & so forth. 


Had Gomez pitched for the St Louis Browns (46-108 in 1937) or had Ford pitched for the ’61 Kansas City Athletics (61-100), we might remember them quite differently. Could they have produced outstanding seasons on those teams the way Carlton did for the 1972 Phillies? No one can say for sure; my own guess is they would have been good but not excellent. For instance, Baseball Reference assigns Ford a “wins against replacement’ figure of 3.5 for his 1961 season. Meanwhile, Kansas City’s Jim Archer, is assigned a 3.7—marginally higher in value in terms of producing team wins. Yet Archer’s record was 9-15. On the other hand, Gomez is credited with a WAR of 9.0 for 1937—& 9.0 is outstanding. The highest WAR value of any 137 Browns’ pitcher is Jack Knott’s 2.6. Knott’s 1937 record was 8-18. For purposes of example only, say that the Browns had used Gomez rather than Knott—based on WAR (which is admittedly an inexact science), & assuming that all his “wins against replacement” were added to his own won-lost record, we’d calculate that Gomez would have won 14-15 games total that year. Not bad at all for a pitcher on a really poor team, but not in the realm of Carlton’s 1972 season. Carlton’s WAR in 1972 (again, using Baseball Reference) was 11.7, which actually seems low if we take the figure literally. The next highest win total for any Phillies starting pitcher that year was 4 (a tie between Woody Fryman & Bill Champion)!

The question I believe sabermetricians would ask is this: is a pitcher’s ability to win games specifically a measurable skill? This would address the traditionalists’ concepts of “pitching to the score” (gauging one’s performance to the game score so that one may allow more runs in a high-scoring game & fewer in a low-scoring game) & “knowing how to win.” The traditionalists use such concepts to boost several careers to a stature the sabermetricians believe is not reflected in a deeper understanding of the statistics. Perhaps the most prominent figure in such a debate is Jack Morris, who pitched for the Detroit Tigers & the Toronto Blue Jays in the 1980s thru early 1990s. Not only did he have some high win total seasons, but he also pitched some notable postseason games; as a result, his Hall of Fame candidacy is strongly supported by traditionalists, but decried by sabermetricians, who point to the fact that many of the more sophisticated stats show Morris to be a more-or-less average pitcher on good teams who had a few very good performances in key games.


I remember watching Morris pitch, & I always thought of him as a strong pitcher just based on the games I saw on the television—I never saw him pitch live. As far as him being a Hall of Fame candidate? I defer to the folks on both sides of the argument—Hall of Fame election is so complicated by the inclusion of some players who perhaps ideally wouldn’t be there & the exclusion of some players who ideally should be that it’s difficult for me to take a stand on a player like Morris. I doubt I’d be much chagrined whichever way that plays out. But I do think there’s a lot of force behind the argument that his stats were helped in a significant way by the strength of his teams.

Of course, I always like to complicate these little statistical discussions a bit. While I mostly come down on the sabermetric/contemporary side when considering pitcher wins, I do wonder if their radical devaluation in that community is to some extent a response to the different use of the starting pitcher over the past 25 years. Even thru the 1970s, starting pitchers completed a high percentage of games they started; the prominence of the relief pitcher only began gaining real traction in the 1970s, & the current state of affairs, in which a starting pitcher is presumed to have done his job if he pitches 6 innings allowing 3 or fewer earned runs (a so-called “Quality Start,” tho if he allows the full complement of runs, the pitcher has a decidedly mediocre 4.50 earned run average for the game.) Since the final three innings of the game are frequently in the hands of relief pitchers—& even in a game where the starting pitcher dominates, there’s usually one or two innings handled by relievers—his won-lost record is not only affected by the ability of his team to score runs & play defense, but also by the ability of his team’s bullpen to hold a lead. 


For those who aren’t familiar with baseball stats, a “win” is awarded to a starting pitcher who completes at least 5 innings, leaves the game (whether at the end of 5 innings or 9) with his team leading, & with his team never surrendering the lead subsequently until the game’s end. If a relief pitcher loses the lead, the starting pitcher cannot get credit for a win even if his team later comes back to win the game. In fact, some relief pitcher “wins” come in games where this happens & they can be credited with a win despite having pitched poorly! There have been notable examples of this in 2012; the Milwaukee Brewers bullpen has given up leads 26 times when the team had a lead of between 1 to 3 runs (a so called “blown save”); as another example, Phillies pitcher Cliff Lee has a won-lost record of 4-7 despite having pitched almost a full season, having solid stats in other categories & still being considered by many analysts to be one of the top pitchers in the National League. In Lee’s case, the low win total is directly attributable to two factors: a weak bullpen & an offense that has trouble scoring runs.

So here we are again: the chicken or the egg? The pitcher or the team? The answer will say so much about you! As Macrobius said:

You jest about what you suppose to be a triviality, in asking whether the hen came first from an egg or the egg from a hen, but the point should be regarded as one of importance, one worthy of discussion, and careful discussion at that.


All images link to their source
  1. Steve Carlton: links to http://i.cdn.turner.com
  2. alimenti,uova,Taccuino Sanitatis, Casanatense, 14th century: Wiki Commons, public domain
  3. Vernon "Lefty" Gomez, 1933 Goudey Baseball Card: WikiCommons, public domain (copyright expired, not renewed)
  4. Plutarch, 16th century woodcut: Wiki Commons, public domain
  5. Jack Morris: links to nationalarmsrace.com
  6. Francisco Rodriguez, one of the Brewers' main relief pitchers: Wiki Commons; by wackybadger on Flickr (Original version) & UCinternational (Crop); published under the Creative Commons Attribution-Share Alike 2.0 Generic license.
  7. Macrobius presenting his work to his son Eustachius (or maybe handing him a baseball card!), ca. 1100: Wiki Commons, public domain